Pile driving formula correlations
An issue came up in a training session last week - how to establish appropriate correction factors for the Hiley Formula (a pile driving formula based on measurement of set and temporary compression (rebound). EVERY pile needs to be driven to an acceptance criterion (e.g. Hiley), but to be valid, it is critical that the adopted criterion be referenced to the results of PDA testing.
Before the contract, PDA testing has not been performed. In that case, the wave equation program GRLWEAP can be used to develop preliminary correction factors. The GRLWEAP output tabulates energy, pile set and maximum pile deflection (= set + rebound) for each analyzed capacity. These output values are sufficient to compute the capacity by the Hiley Formula. Then it is simply a matter of computing the ratio of Hiley/GRLWEAP and plotting these ratios vs set, as shown in the graph. Rather than the correction factor being a single value (as generally assumed), the values typically plot as a straight line, with a constant value at theoretical zero set, and a variable set multiplier. I call this DRF or the Dynamic Reduction Function, and I have been using this approach for some 15 years now on many hundreds of projects.
In the graph shown, the constant value is 1.40 and the variable is 0.018/mm of set - so at a set of 2mm, the Hiley correction factor is 1.436 and at 10mm set the correction factor increases to 1.58. The example shown is actually the same technique applied to Capwap results (the different colours relate to different energy levels), but as discussed, this technique can be used to provide interim acceptance using GRLWEAP even in advance of pile driving and PDA testing. The PDM3 can be used to safely and remotely measure set and temporary compression both on land and for barge-driven piles.
#piledriving #pile #piles #pdatesting #GRLWEAP #CAPWAP #pileacceptance #PDA #PDM3 #piledrivingmonitoring #pilemonitoring #marinepiles #ConstructionQA #FoundationQA
https://www.linkedin.com/posts/julian-seidel-68579018_piledriving-pile-piles-activity-7163634129887055872-TBLA?utm_source=share&utm_medium=member_desktop
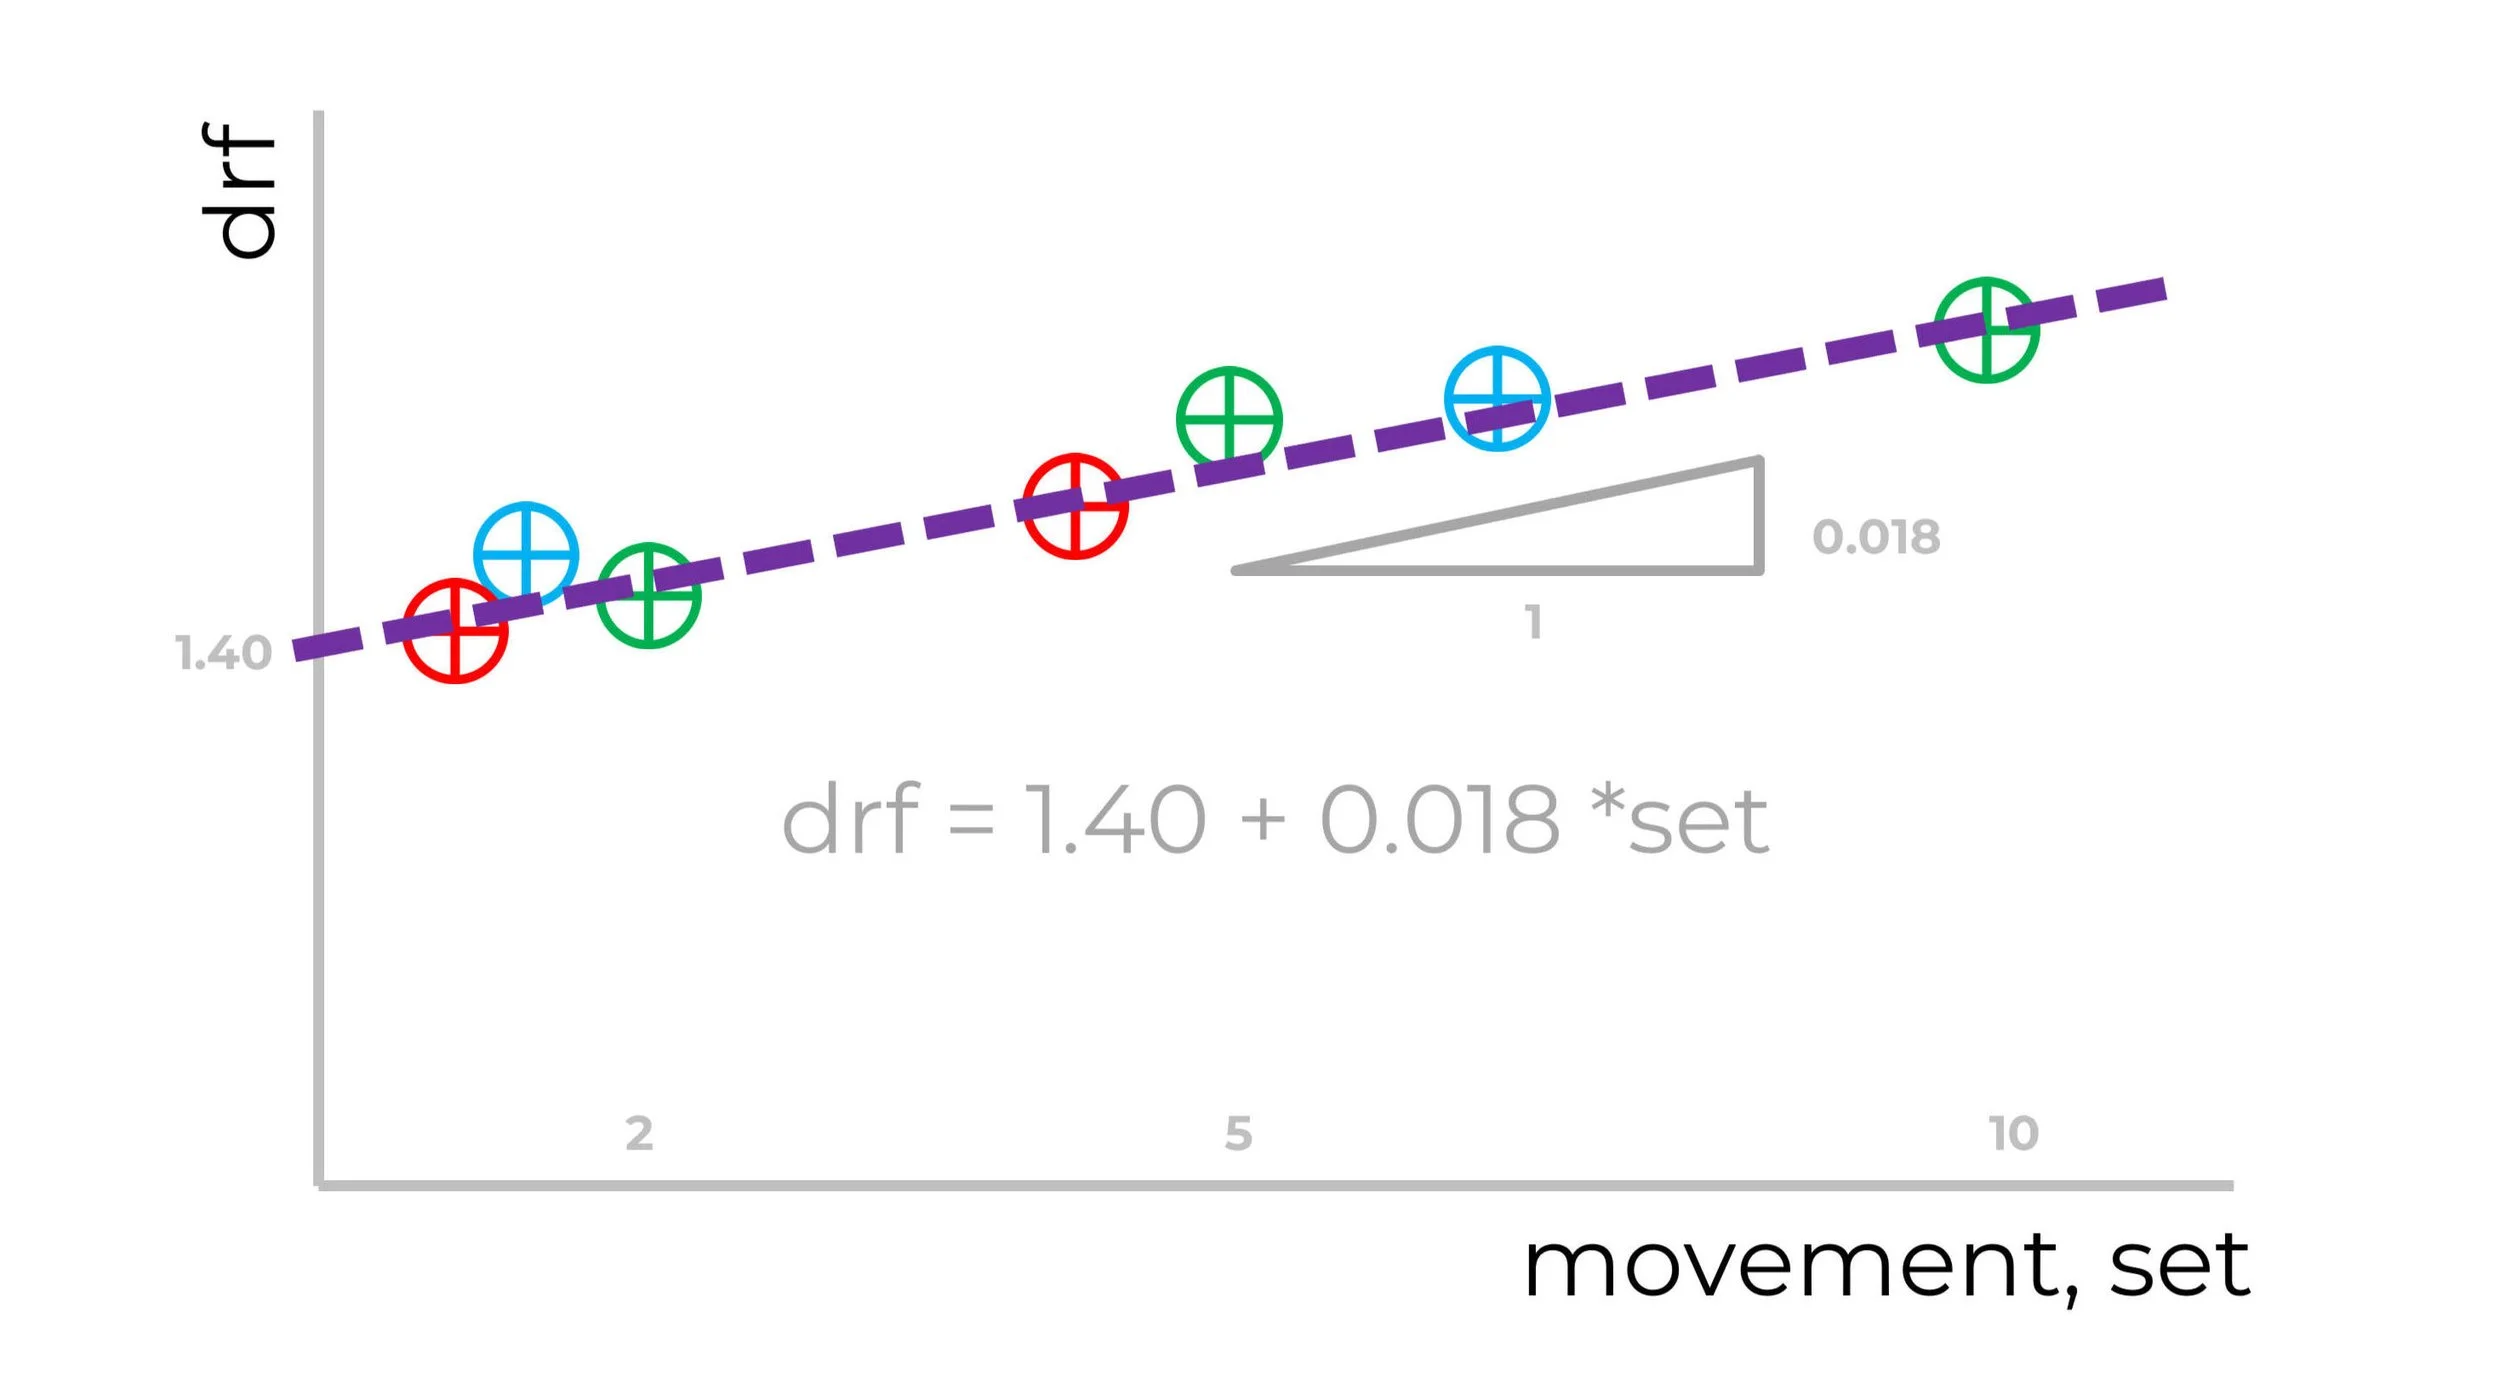
This data is from Capwap analyses. The red blue and green points represent low, medium, and high energy blows